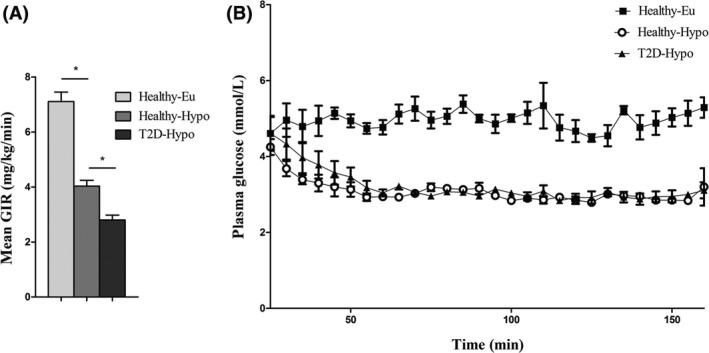
Figure 1.

A, Time course of plasma glucose levels during the clamps. At time point 0, insulin infusion started. Black squares indicate values of the euglycaemia group. For hypoglycaemia: open circles, healthy participants; black triangles, type 2 diabetic participants. B, Mean glucose infusion rates during the procedure. Data are shown as means ± SD. *P < 0.05 by Bonferroni‐Dunn test
