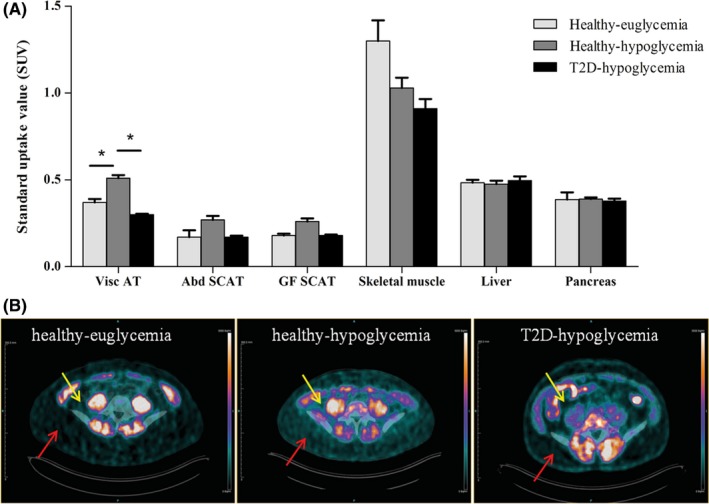
Figure 2.

Uptake of 18F‐FDG in different AT depots and other organs (A) across the groups. Bars represent means ± SEM. *P < 0.05 by Bonferroni‐Dunn test. [18F]FDG uptake ratios between AT and skeletal muscle are 1:6.3 and 1:3.2 for subjects under euglycaemic and hypoglycaemic conditions, respectively. Representative PET images of healthy participants under euglycaemia and hypoglycaemia and type 2 diabetes patients under hypoglycaemia (B). Yellow arrows indicate visceral AT, and red arrows indicate abdominal subcutaneous AT
