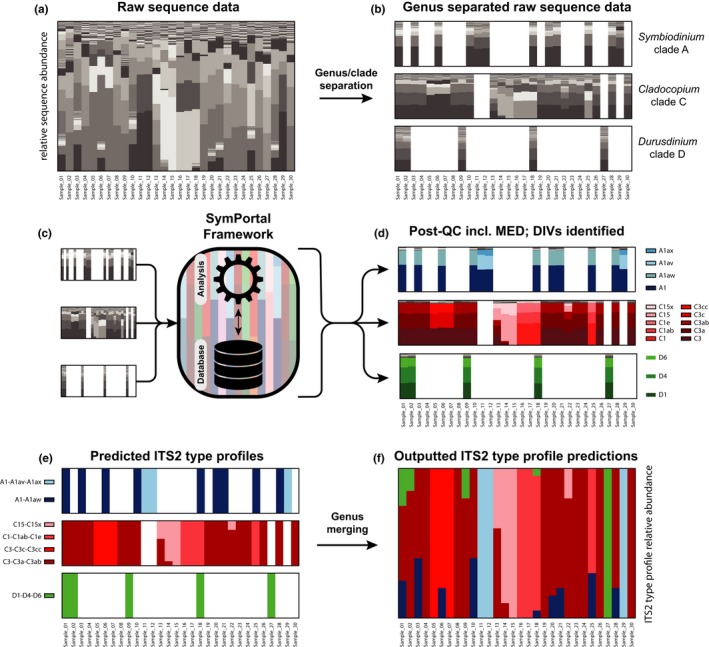
Figure 2.

Determination of ITS2 type profiles in samples containing mixed Symbiodiniaceae communities. In all subplots, each stacked bar represents sequence data or predicted ITS2 type profiles for a single given sample with individual bars of the stack representing relative abundances within the sample. Coloured bars represent specific ITS2 sequences or ITS2 type profiles. Grey scale bars represent unidentified ITS2 sequences. (a) Samples that contain ITS2 sequence diversity originating from intergenomic and intragenomic variation are submitted to SymPortal. (b) Raw sequences are separated by genus as part of the standard quality control pipeline. (c–e) The remaining analysis is conducted on the genus‐separated sequence data, but only genus‐separated collections of more than 200 sequences (per sample) are searched for ITS2 type profiles to minimize sequencing depth artefacts. Multiple ITS2 type profiles of the same genus (e.g. C15‐C15x and C3‐C3a‐C3ab) may be predicted within individual samples, if each of the ITS2 type profiles are found in isolation in the current or previously analysed data sets. (f) Before output, the genus‐separated predicted ITS2 type profiles are merged and abundances are adjusted relative to preseparation proportions. The data used in this figure have been generated for the purpose of illustration and are not based on actual data. The code used to generate the data can be found at https://github.com/didillysquat/sp_ms_figure_creation [Colour figure can be viewed at wileyonlinelibrary.com]
