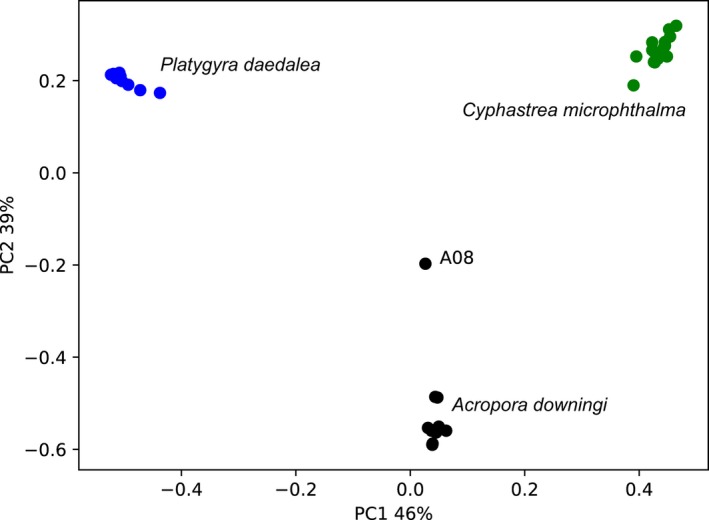
Figure 4.

Principal coordinate analysis (PCoA) plot based on UniFrac distances between Cladocopium (formerly Clade C; LaJeunesse et al., 2018) ITS2 sequences found in samples from this study. The plot is made directly from the principal component coordinates output as part of the SymPortal analysis (File S11). Samples are coloured according to host species, as annotated. Sample A08 is separately annotated given its dissimilarity from the main Acropora spp. cluster [Colour figure can be viewed at wileyonlinelibrary.com]
