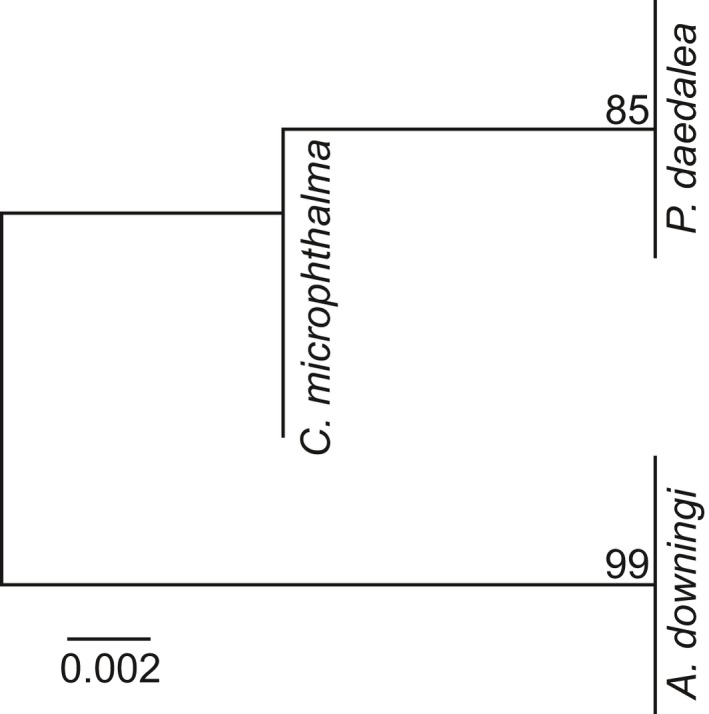
Figure 5.

Unrooted maximum likelihood phylogeny based on the psbA ncr sequences from all the samples associated with the Smith, Ketchum et al. (2017b) study. Samples resolved in three positions on the tree according to host species, as annotated. Bootstrap support values < 100 (100 replicates) are annotated
