
Figure 2.
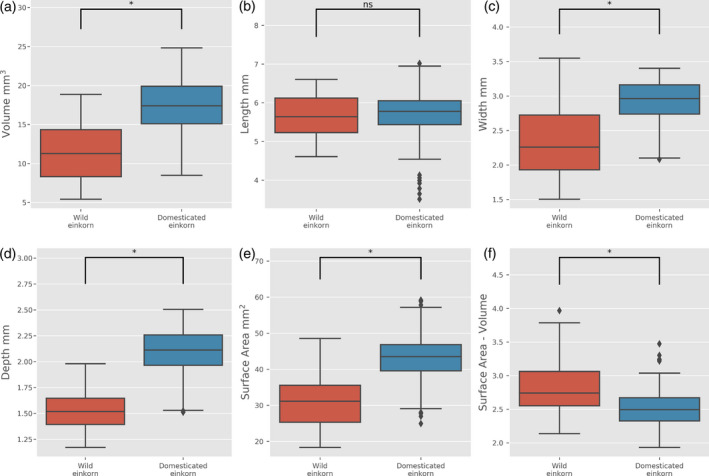
Relationship between domestication status and morphometric trait variation of wild (red boxes, 237 grains) and domesticated (blue boxes, 513 grains) einkorn wheat. Horizontal lines in boxplots represent median, boxes indicate the upper and lower interquartile range, whiskers indicate the largest and smallest values within 1.5 times the interquartile range and points indicate outliers outside this range for grain volume (a), length (b), width (c), depth (d), surface area (e) and surface area to volume ratio (f). Asterisks indicate that the values are significantly different at P < 0.01, ns, not significant.