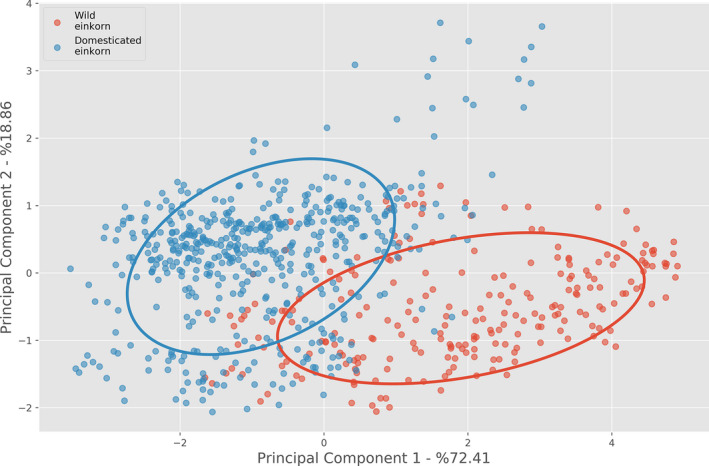
Figure 3.

Principal component analysis of grain traits obtained by 3D μCT analysis for wild (red circles, n = 237) and domesticated (blue circles, n = 513) einkorn wheat, with two times standard deviation outlined. The first two principal components are shown.
