
Figure 6.
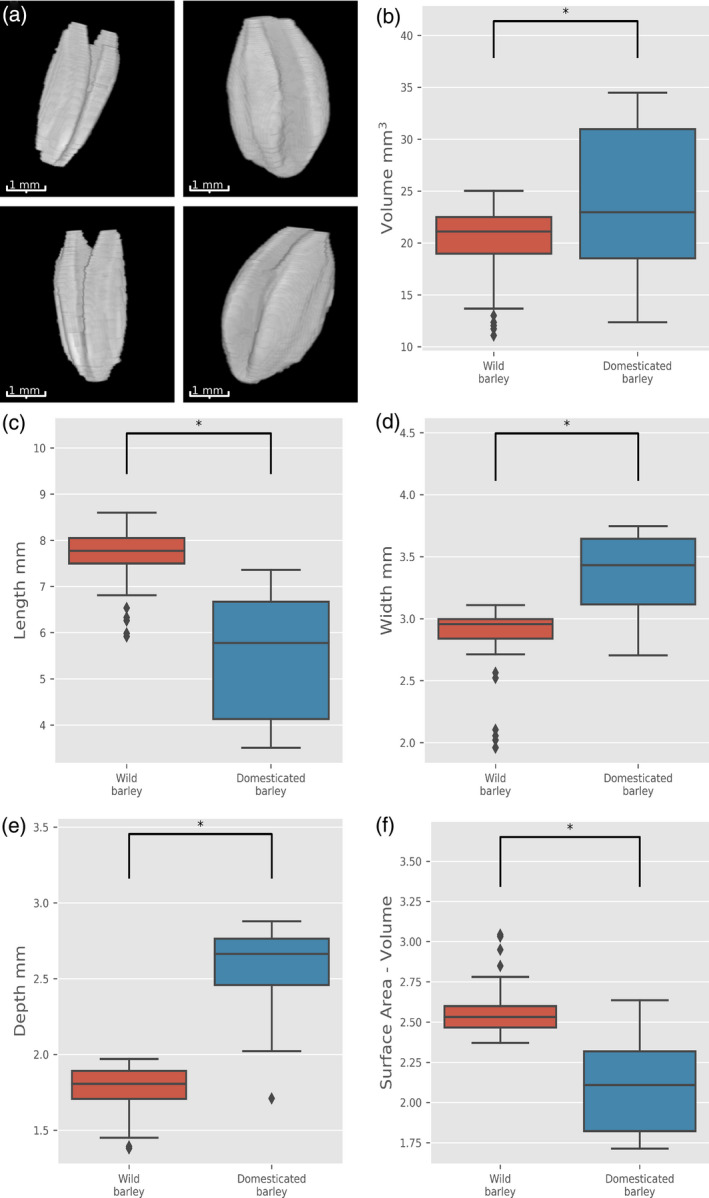
Analysis of grain trait changes associated with barley domestication. (a) 3D reconstruction of representative wild (left) and domesticated (right) barley grains. Grain traits measured were volume (b), length (c), width (d), depth (e) and surface area to volume ratio (f). Horizontal lines in boxplots represent median, boxes indicate the upper and lower interquartile range, whiskers indicate the largest and smallest values within 1.5 times the interquartile range and points indicate outliers outside of this range (red boxes − wild, 49 grains; blue boxes − domesticated, 141 grains). Asterisks indicate that the values are significantly different for P < 0.01.