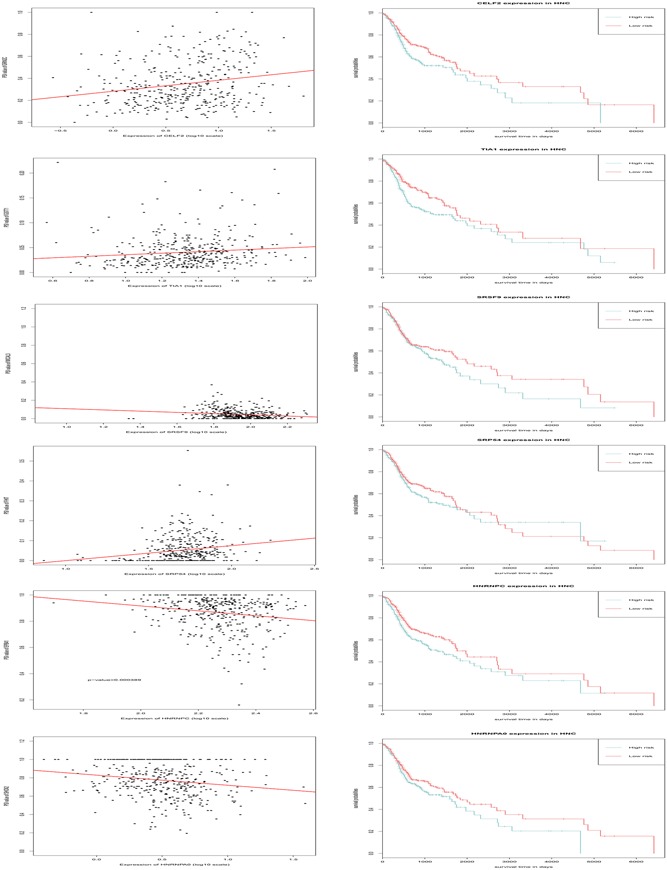
Figure 9.

(a) Correlations between expression of splicing factors and Percent Spliced In (PSI) values of alternative splicing (AS) events (p < 0.05). (b) Kaplan–Meier (KM) survival plot for splicing factors [Color figure can be viewed at wileyonlinelibrary.com]
