
Figure 1.
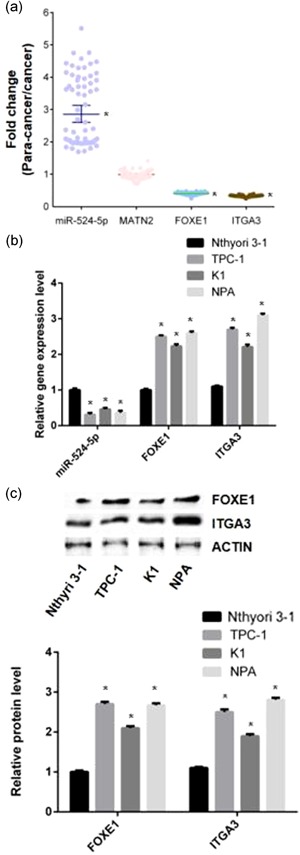
The expression of miR‐524‐5p is the association with FOXE1 and ITGA3 in PTC tissues. (a) The expression of miR‐524‐5p, MATN2, FOXE1, and ITGA3 in PTC comparing to papa‐cancer tissues. (b) The messenger RNA levels of miR‐524‐5p, FOXE1, and ITGA3 were determined by quantitative reverse‐transcription polymerase chain reaction in normal thyroid cell (Nthyori 3‐1) and three types of PTC cell lines (TPC‐1, K1, and NPA). (c)The FOXE1 and ITGA3 protein expression levels were determined by western blot analysis in normal thyroid cell (Nthyori 3‐1) and three types of PTC cell lines (TPC‐1, K1, and NPA). Actin was detected as a loading control. FOXE1: forkhead box E1; MATN2: matrilin 2; PTC: papillary thyroid cancer [Color figure can be viewed at wileyonlinelibrary.com]