
Figure 4.
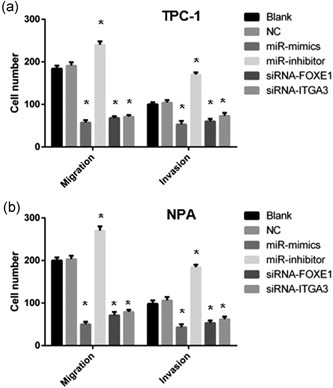
Cell migration and invasion of miR‐524‐5p, FOXE1, and ITGA3 in TPC‐1 (a) and NPA (b) cells were determined by scratch test and transwell assay. miR‐524‐5p mimic group showed decreased numbers of migration and invasion cells, while miR‐524‐5p inhibitor groups showed significantly increased numbers. Both siRNA‐FOXE1 and siRNA‐ITGA3 groups showed reduced cell numbers (p < 0.05). FOXE1: forkhead box E1; siRNA: small interfering RNA