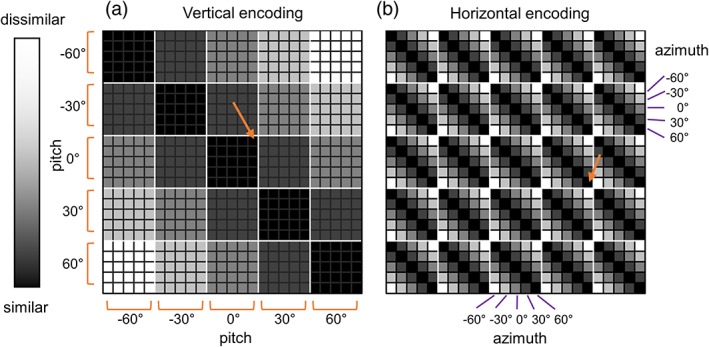
Figure 3.

The model representational similarity matrix. The representational similarity matrix (25 × 25) contained pairwise similarity values between each of 25 unique 3D directions. (a) If the vertical direction was encoded, the neural similarity between the directions that share common vertical tilt, pitch would be high (dark colors), for example, between (pitch, azimuth) = (0°, −60°) and (0°, 60°) as indicated by the orange arrow. Similarity falls as the difference in pitch between two directions increases. (b) If the horizontal direction is encoded, the neural similarity between the directions that share a common horizontal angle, azimuth would be high (dark colors), for example, between (pitch, azimuth) = (0°, 60°) and (30°, 60°), as indicated by the orange arrow. Similarity falls as the difference in azimuth between two directions increases [Color figure can be viewed at wileyonlinelibrary.com]
