Figure 5.

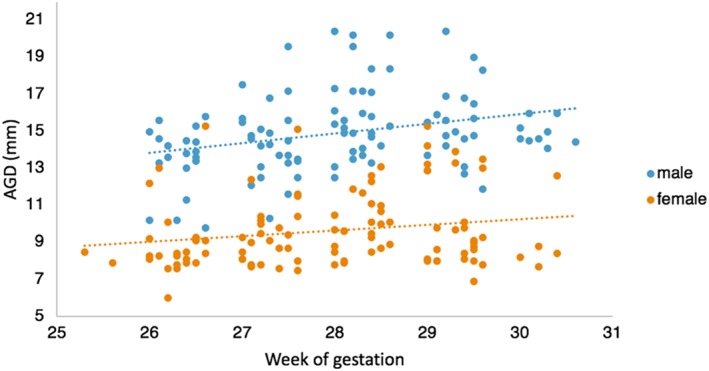
A scatterplot of raw AGD measures split by males fetuses and female fetuses between 25 and 31 weeks of gestation. Mean linear regression lines have been plotted by sex [Colour figure can be viewed at wileyonlinelibrary.com]

A scatterplot of raw AGD measures split by males fetuses and female fetuses between 25 and 31 weeks of gestation. Mean linear regression lines have been plotted by sex [Colour figure can be viewed at wileyonlinelibrary.com]