Figure 6.

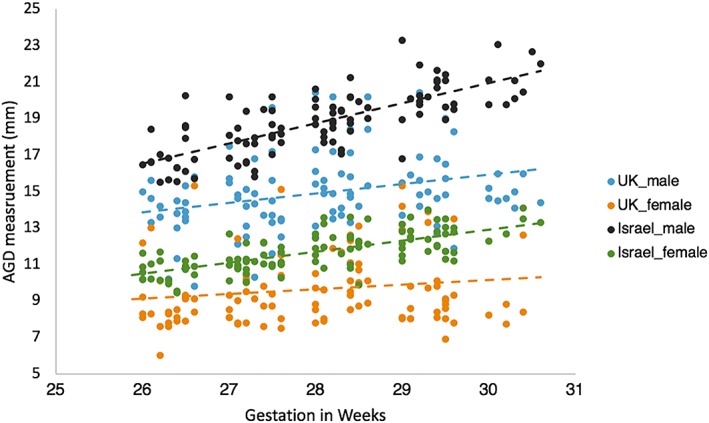
A scatterplot of matched raw AGD measures taken in both UK and Israel populations by sex between 26 and 31 weeks of gestation. Mean linear regression lines have been plotted by sex [Colour figure can be viewed at wileyonlinelibrary.com]

A scatterplot of matched raw AGD measures taken in both UK and Israel populations by sex between 26 and 31 weeks of gestation. Mean linear regression lines have been plotted by sex [Colour figure can be viewed at wileyonlinelibrary.com]