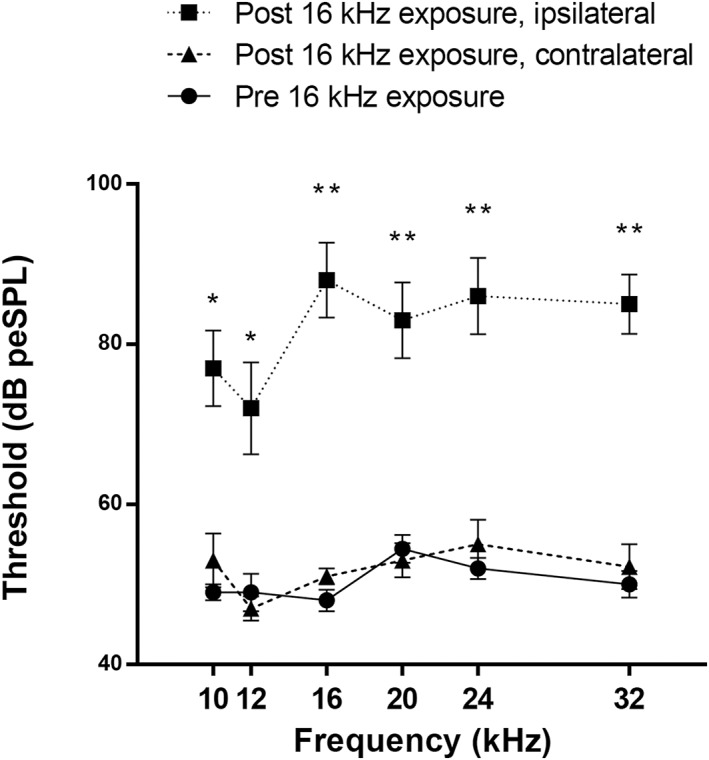
Figure 3.

Auditory brainstem responses measured at baseline (round, solid) and after noise exposure in the traumatized ear (square, dotted) and the contralateral side (triangle, dashed). Thresholds are presented as means ± SE. * p < 0.05; ** p < 0.001.
