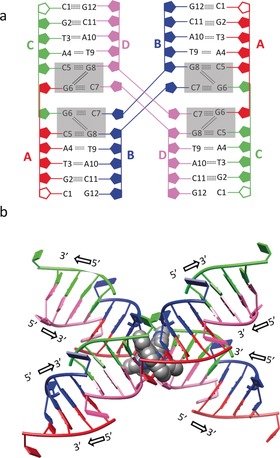
Figure 3.

Different views of the four‐way‐junction DNA arrangement in the crystal structure of 1–CGTACG. a) Base‐pair arrangement and hydrogen‐bonding interactions. Complex 1 is not shown; the binding site in each column is shown as two gray rectangles. The C1A and C1C residues, not localized in the electron‐density map, are represented by empty (not colored) ribose rings. b) “X” conformation and 5′ and 3′ DNA growth directions; the two molecules of 1 are shown as a CPK model (only conformer F is shown for clarity).
