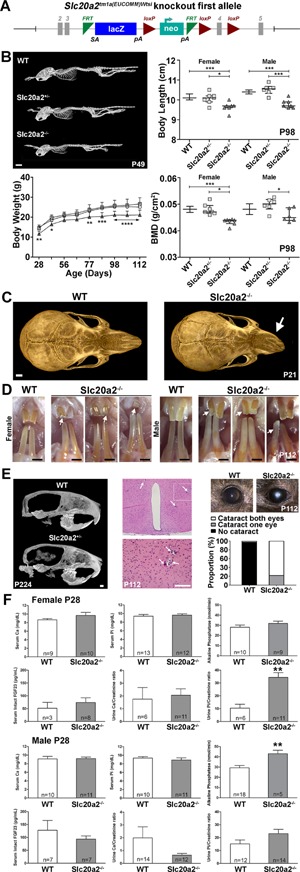
Figure 1.

Primary phenotype of Slc20a2–/– mice. (A) Slc20a2 knockout‐first conditional ready allele (reporter‐tagged insertion allele). The gene‐trap knockout is generated using a targeting cassette containing lacZ and neomycin marker genes. (B) μCT images of P49 female WT, Slc20a2+/–, and Slc20a2–/– mice. Scale bar = 5 mm. Body length in female and male WT, Slc20a2+/–, and Slc20a2–/– mice at P98 (medial with interquartile range, n = 6 to 1474 per sex, per genotype, *p < 0.05, ***p < 0.001; Kruskal‐Wallis test followed by Dunn's post hoc test). Body weight in female WT, Slc20a2+/–, and Slc20a2–/– mice between P28 and P112 (mean ± SD, n = 6 to 34, per genotype per age, *p < 0.05, **p < 0.01, ***p < 0.001, ****p < 0.0001 versus WT; ANOVA followed by Tukey's post hoc test). DXA BMD in female and male WT, Slc20a2+/–, and Slc20a2–/– mice at P98 (median with interquartile range, n = 6 to 1469 per sex, per genotype, *p < 0.05, ***p < 0.001; Kruskal‐Wallis test followed by Dunn's post hoc test). (C) Apical μCT images of skulls from P21 WT and Slc20a2–/– mice. Scale bar = 1 mm. Arrows indicate abnormal nasal bones in Slc20a2–/– mice. (D) Images of incisors from male and female P112 WT and Slc20a2–/– mice. Scale bars = 1 mm. (E) Midline sagittal μCT images of skulls from WT and Slc20a2–/– mice at P224. Scale bar = 1 mm. Low‐power and high‐power coronal sections of the brain in Slc20a2–/– mice at P112; arrows indicate soft tissue calcification. Scale bar = 100 µm. Images of the eye in WT and Slc20a2–/– mice at P112 and the incidence of cataract. (F) Serum and urinary calcium (Ca) and phosphate (Pi) and serum intact FGF23 and ALP activity in female and male WT and Slc20a2–/– mice at P28 (mean ± SE, n = 3 to 14 per genotype per age, **p < 0.01, ***p < 0.001 versus WT; Mann‐Whitney U test).
