Figure 5.

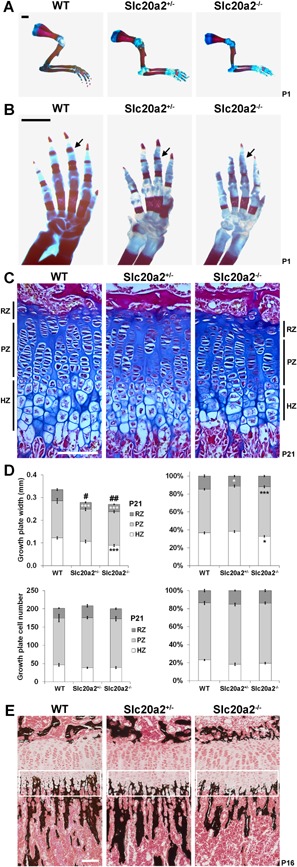
Impaired postnatal skeletal development in Slc20a2–/– mice. (A) Forelimbs from P1 WT, Slc20a2+/–, and Slc20a2–/– mice stained with Alizarin red (bone) and Alcian blue (cartilage). Scale bar = 1 mm. (B) Forelimb digits stained with Alizarin red and Alcian blue. Scale bar = 1 mm. Black arrows indicate delayed formation of primary ossification centers in P1 Slc20a2+/– and Slc20a2–/– mice. (C) Decalcified sections of proximal tibia from P21 WT, Slc20a2+/–, and Slc20a2–/– mice stained with Alcian blue (cartilage) and van Gieson (bone matrix). Scale bar = 100 µm. (D) Upper left graph shows growth plate, RZ, PZ, and HZ heights. Upper right graph shows relative values, where each zone is shown as a percentage of total growth plate height (mean ± SE, n = 8 per genotype, *p < 0.05, ***p < 0.001 versus height of zone in WT, #p < 0.05, ##p < 0.01 versus total growth plate height in WT; ANOVA followed by Tukey's post hoc test). Lower left graph shows chondrocyte cell number in RZ, PZ, and HZ. Lower right shows relative values, where cell number in each zone is shown as a percentage of total cell number (mean ± SEM, n = 8 per genotype). (E) Undecalcified sections of P16 proximal tibia stained with Von Kossa (mineral deposition in black). HZ ROI is indicated by white rectangle. Scale bar = 100 µm. RZ = reserve zone; PZ = proliferating zone; HZ = hypertrophic zone.
