Figure 2.

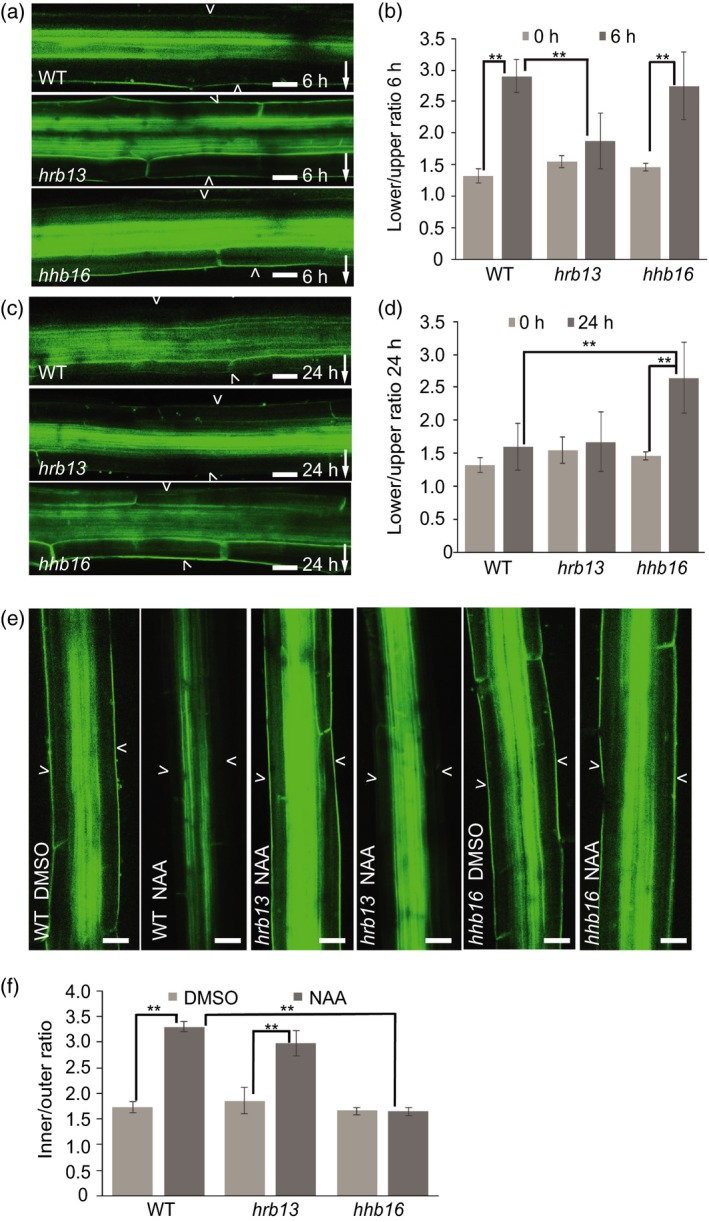
Defective PIN3‐GFP polarization events in hrb13 and hhb16 mutants.
(a) PIN3‐GFP in wild‐type, hrb13 mutant, hhb16 mutant after 6 h gravity stimulation. Scale bar: 20 μm. Arrowheads depict outer sides of endodermal cells. Arrow indicates gravity direction.
(b) Quantification of PIN3‐GFP signal in hrb13 mutant, hhb16 mutant after 6 h gravistimulation. PIN3‐GFP fluorescence was compared between outer side of endodermal cells at the lower and upper sides of hypocotyl. Error bars are SE (N > 15 seedlings for each replicate, Student's t‐test, **P < 0.05).
(c) PIN3‐GFP in wild‐type, hrb13 mutant, hhb16 mutant after 24 h gravity stimulation. Scale bar: 20 μm. Arrowheads depict outer sides of endodermal cells. Arrow indicates gravity direction.
(d) Quantification of PIN3‐GFP signal in hrb13 mutant, hhb16 mutant after 24 h gravistimulation. PIN3‐GFP fluorescence was compared between outer side of endodermal cells at lower and upper sides of hypocotyl. Error bars are SE (N > 15 seedlings for each replicate, Student's t‐test, **P < 0.05).
(e) PIN3‐GFP in wild‐type, hrb13 mutant, hhb16 mutant after 4 h dimethylsulfoxide (DMSO) or NAA treatment. Scale bar: 20 μm. Arrowheads depict outer sides of endodermal cells.
(f) Quantification of PIN3‐GFP signal in hrb13 mutant, hhb16 mutant after 4 h NAA treatment. PIN3‐GFP fluorescence was compared between inner and outer sides of endodermal cells. Error bars are SE (N > 15 seedlings for each replicate, Student's t‐test, **P < 0.05).
