
Figure 4.
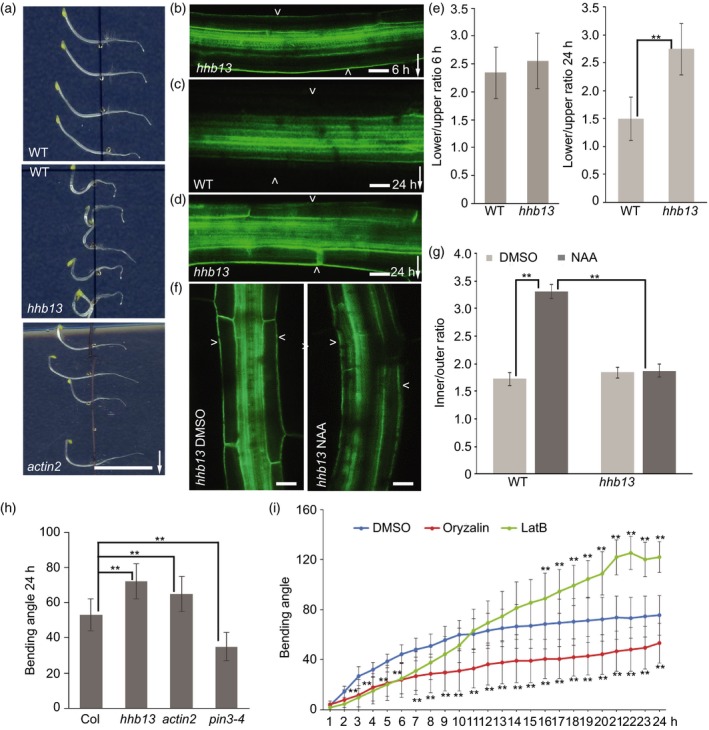
Characterization of hhb13 mutant.
(a) Images of 24 h gravity stimulated wild‐type, hhb13 and actin2 mutants. Scale bar: 2 cm. Arrow indicates gravity direction.
(b) PIN3‐GFP in hhb13 mutant after 6 h gravity stimulation. Scale bar: 20 μm.
(c) PIN3‐GFP in wild‐type after 24 h gravity stimulation. Scale bar: 20 μm.
(d) PIN3‐GFP in hhb13 mutant after 24 h gravity stimulation. Scale bar: 20 μm. Arrowheads depict the outer sides of endodermal cells. Arrow indicates gravity direction.
(e) Quantification of PIN3‐GFP signal after 6 and 24 h gravity stimulation in wild‐type and hhb13 mutant. PIN3‐GFP fluorescence was compared between the outer side of endodermal cells at the lower and upper sides of hypocotyl. Error bars are SE (N > 15 seedlings for each replicate, Student's t‐test, **P < 0.05).
(f) PIN3‐GFP in hhb13 mutant after 4 h DMSO or NAA treatment. Scale bar: 20 μm. Arrowheads depict the outer sides of endodermal cells.
(g) Quantification of PIN3‐GFP signal after DMSO or NAA treatment in hhb13 mutant. PIN3‐GFP fluorescence was compared between the inner and outer sides of endodermal cells. Error bars are SE (N > 15 seedlings for each replicate, Student's test, **P < 0.05).
(h) Bending angle of wild‐type, hhb13, actin2, pin3‐4 mutant after 24 h gravistimulation. Error bars are SE (N > 25 seedlings for each replicate, Student's t‐test, **P < 0.05).
(i) Bending kinetics of wild‐type seedlings treated with DMSO, latrunculin B (LatB) and oryzalin. Pictures were taken at 1‐h intervals. Error bars are SE (N > 25 seedlings for each replicate, Student's t‐test between DMSO and LatB treatment, **P < 0.05; Student's t‐test between DMSO and oryzalin treatment, **P < 0.05).