Figure 5.

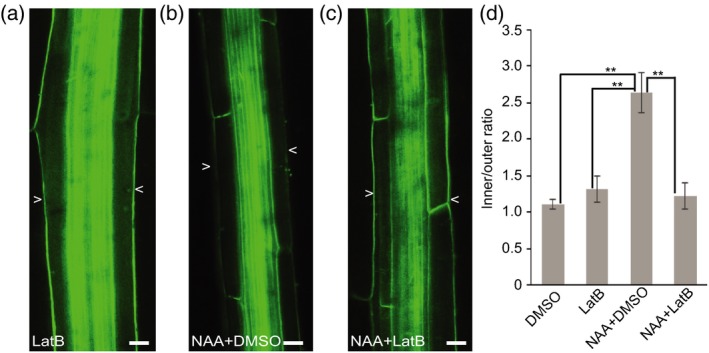
Latrunculin B (LatB) inhibits auxin‐induced PIN3‐GFP polarization.
(a) PIN3‐GFP in wild‐type after 30 μm LatB treatment for 4 h. Scale bars: 20 μm.
(b) PIN3‐GFP in wild‐type after 10 μm NAA and dimethylsulfoxide (DMSO) co‐treatment for 4 h. Scale bars: 20 μm.
(c) PIN3‐GFP in wild‐type after 30 μm LatB and 10 μm NAA co‐treatment for 4 h. Scale bars: 20 μm. Arrowheads depict the outer sides of endodermal cells.
(d) Quantification of PIN3‐GFP signal. PIN3‐GFP fluorescence was compared between the inner and outer sides of endodermal cells. Error bars are SE (N > 15 seedlings for each replicate, Student's t‐test, **P < 0.05).
