
Figure 1.
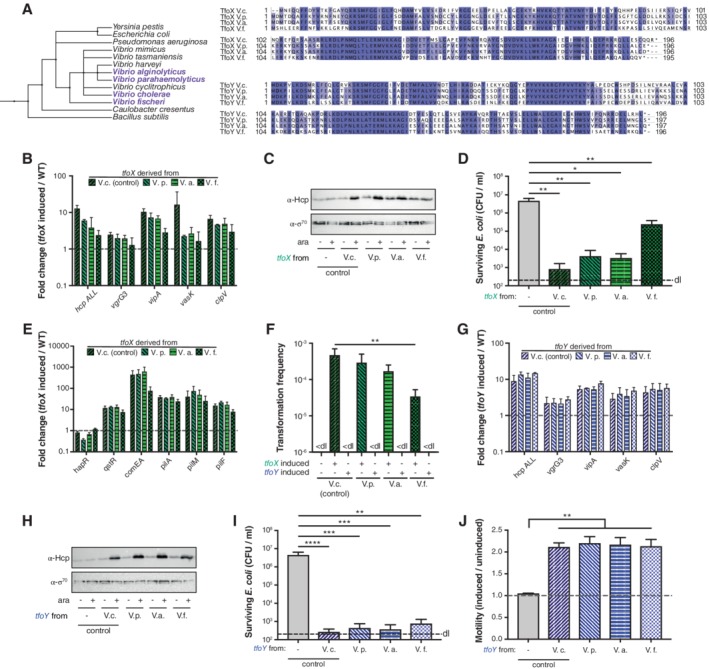
TfoX and TfoY proteins from diverse Vibrio species are functional in V. cholerae.
A. Phylogenetic tree and protein sequence conservation of TfoX and TfoY across Vibrio species. The phylogenetic tree was generated on phlyot.biobyte.de, a phylogenetic tree generator, based on NCBI taxonomy. The protein sequences of TfoX and TfoY were aligned using ClustalOmega, and subsequently modified with Jalview. Identical residues are highlighted in shades of blue (above threshold of 65%).
B–J. Chromosomally‐located tfoX and tfoY from cholera (V. cholerae) and non‐cholera Vibrio species (V. parahaemolyticus, V. alginolyticus and V. fischeri) were expressed under the control of the arabinose‐inducible PBAD promoter in V. cholerae. The colour code (TfoX‐induced, green; TfoY‐induced, blue) is used throughout the graphs. The WT strain lacking an inducible copy of tfoX or tfoY served as the negative control. The fold change (tfoX‐ or tfoY‐induced over parental WT strain) of relative gene expression of (B, G) T6SS genes or (E) representative competence genes is shown.
C, H. Detection of Hcp protein produced by TfoX‐ and TfoY‐expressing cells. Cells were grown in the absence or the presence of the inducer (arabinose) as indicated below the image. Detection of σ70 served as a loading control.
D, I. Interspecies killing assay with E. coli as prey. V. cholerae harbouring different inducible versions of (D) tfoX or (I) tfoY were co‐cultured with the prey on LB agar plates supplemented with arabinose. The survival of the prey was determined on selective LB agar plates and is depicted as CFU per ml.
F. Natural transformation using genomic DNA is maintained in a V. cholerae strain expressing tfoX from non‐cholera vibrios but is nonfunctional upon tfoY expression. The indicated strains were grown under inducible conditions, and the genomic DNA of A1552‐lacZ‐Kan served as the transforming material. Transformation frequencies reflect the number of transformants divided by the total number of CFUs. < dl, below detection limit.
J. Motility was scored on soft agar with and without arabinose as an inducer. The motility phenotype was quantified as the ratio between the induced and uninduced conditions, as shown on the Y‐axis. Abbreviations: V.c., Vibrio cholerae A1552, V.p., Vibrio parahaemolyticus RIMD2210633; V.a., Vibrio alginolyticus 12G01; V.f., Vibrio fischeri ES114. Bar plots represent the average of at least three independent biological replicates (± SD). Statistical significance is indicated (*p < 0.05; **p < 0.01; ***p < 0.001; ****p < 0.0001).