
Figure 2.
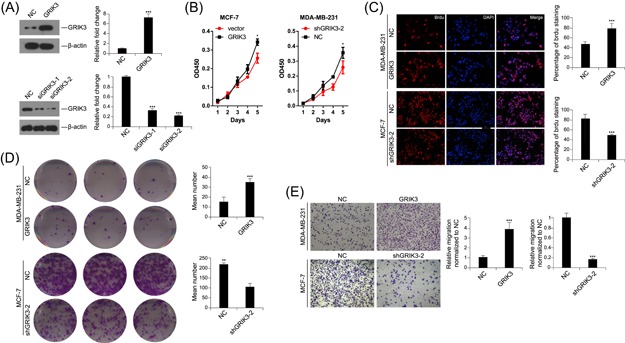
GRIK3 promoted cell proliferation and migration. A, Western blot analysis of GRIK3 expression in GRIK3 overexpression and knockdown cells. ***P < 0.001 by One‐way ANOVA. B, The CCK‐8 assay showing the effect of GRIK3 overexpression or knockdown on the proliferation of breast cancer cell lines. *P < 0.05 by the repeated measure of ANOVA. C. The number of positive cells was calculated in GRIK3 overexpressing cells, GRIK3 knockdown cells and the control cells in the BrdU assay. ***P < 0.001 by One‐way ANOVA. D, The colony formation assay was used to detect the effect of GRIK3 overexpression or knockdown on MDA‐MB‐231 proliferation. **P < 0.01 and ***P < 0.001 by One‐way ANOVA. E, Migration ability of breast cancer cells induced by GRIK3 overexpression or knockdown was determined by transwell migration assay. ***P < 0.001 by one‐way ANOVA. ANOVA, analysis of variance; GRIK3, glutamate receptor ionotropic, kainate 3; mRNA, messenger RNA [Color figure can be viewed at wileyonlinelibrary.com]