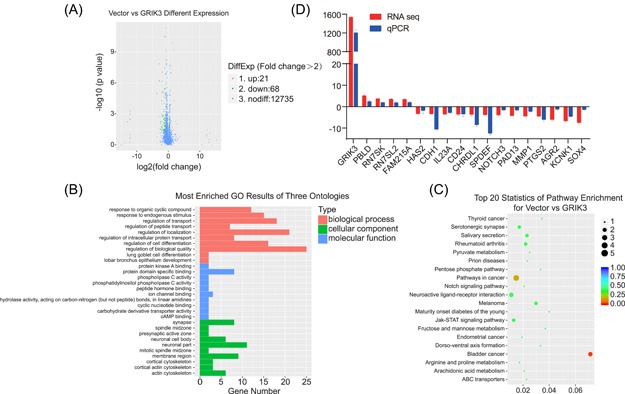
Figure 4.

The gene expression profile and key signal pathways regulated by GRIK3. A, The volcano plot of the differential genes. B, GO analysis of the differential genes. C, KEGG analysis of the differential genes. D, Validation of the differentially expressed genes by qPCR. GO, gene ontology; GRIK3, lutamate receptor ionotropic, kainate 3 [Color figure can be viewed at wileyonlinelibrary.com]
