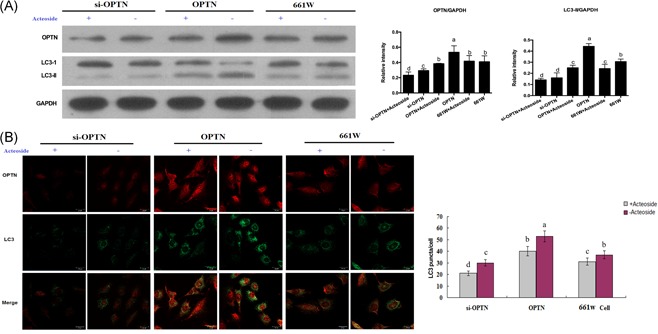
Figure 1.

A, Western blotting showing the inhibition of Acteoside on the autophagy of OPTN overexpression and OPTN knockdown 661 W cells. Results are given as mean ± SEM. Differences between groups were determined by two‐tailed t test (n = 3). B, Immunofluorescence showing the inhibition of Acteoside on the autophagy of OPTN overexpression and OPTN knockdown 661 W cells. The red fluorescence labels the OPTN and the green fluorescence labels the LC3. The number of LC3 puncta/cells indicates autophagic activity. Results are given as mean ± SEM. Differences between groups were determined by two‐tailed t test. Three fields per cell and thirty cells per group were analyzed. Different letters indicate values significantly different among groups (P < .05). OPTN, optineurin; SEM, standard error of mean
