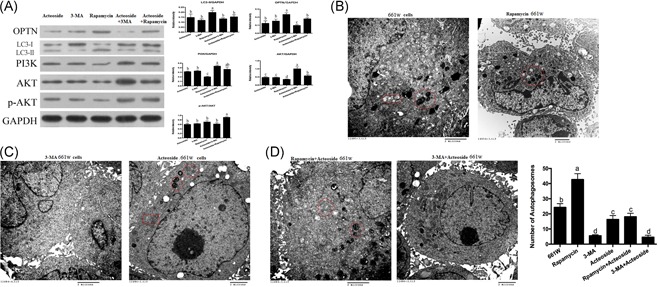
Figure 2.

A, Western blotting showing the effects of Acteoside on the PI3K/AKT/mTOR signaling pathway. 611 W cells were treated as follows: Acteoside, 3‐MA, rapamycin, Acteoside + 3‐MA and rapamycin + 3‐MA. B, TEM shows that Rapamycin induces increased autophagy. The double membrane electro dense particles indicate autophagosomes. C, TEM shows that 3‐MA and Acteoside inhibit autophagy. The double membrane electro dense particles indicate autophagosomes. D, TEM shows the synergistic result of Acteoside with Rapamycin or 3‐MA on the autophagy level. The double membrane electro dense particles indicate autophagosomes (the scar bar represents 2 μm). Results are given as mean ± SEM. Differences between groups were determined by two‐tailed t test (n = 3). Different letters indicate values significantly different among groups (P < .05). SEM, standard error of mean; TEM, transmission electron microscopy
