
Figure 2.
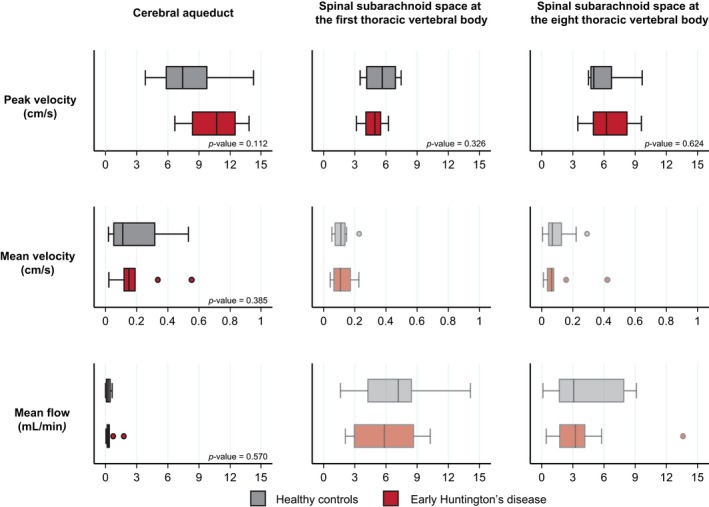
Cerebrospinal fluid flow and velocities do not seem to be different between healthy controls (grey plots) and people with early Huntington's disease (red plots). Faded plots were variables with a sub‐threshold agreement between raters, which were not formally analysed. The boxes extend from the 25th to the 75th percentile with a vertical line for the median (50% percentile). The whiskers extend to the lower and the upper adjacent values (1.5 times the interquartile range plus the 25th or the 75th percentile, respectively). All values outside this range were considered outliers. [Colour figure can be viewed at wileyonlinelibrary.com]