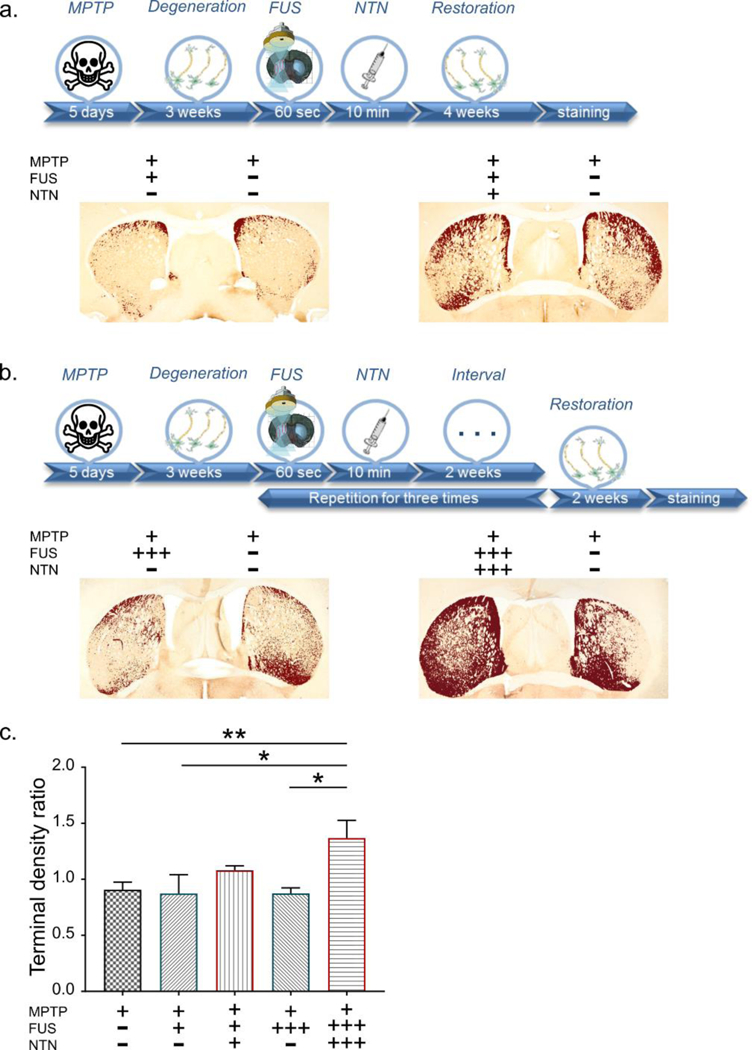
Figure 4:

Neurorestoration effect at the Caudate-Putamen (CPu) region. a. The descriptive timeline of the procedure is followed by representative TH immunohistochemistry images. The pixels surpassing a certain threshold are presented in dark red to enhance the differences between the ipsilateral and contralateral side. The plus/minus signs indicate whether the corresponding side of the brain received MPTP, FUS and NTN. b. Triple treatment at the CPu: The corresponding timeline provides information regarding the additional steps followed for this part of the study. The plus/minus signs indicate whether the brains received MPTP, FUS and NTN and the three plus signs denote the number of times the treatment was repeated. c. The area quantification of the terminal density at the CPu region. Results are shown as the relative ratio by dividing the contralateral side into the ipsilateral side. The statistical significance occurs with one-way ANOVA (n=5–7; F[4, 24] = 3.527; P=0.0212) after correcting the multiple measurements with Newman-Keuls method permeate the CPu as effectively as in the SNr, it may be that the stronger regimen of FUS/NTN is required to achieve the desired effect. Furthermore, within the CPu, TH-positive fibers represent less than 10% of the fiber pool hence, most of the NTN molecules in the CPu might interact with neuronal structures other than TH-positive fibers.
