
Figure 3. The Associations between Quartiles of Steps and Quartiles of Self-reported PA (PASE score) and β-Diversity Principal Coordinate Analysis.
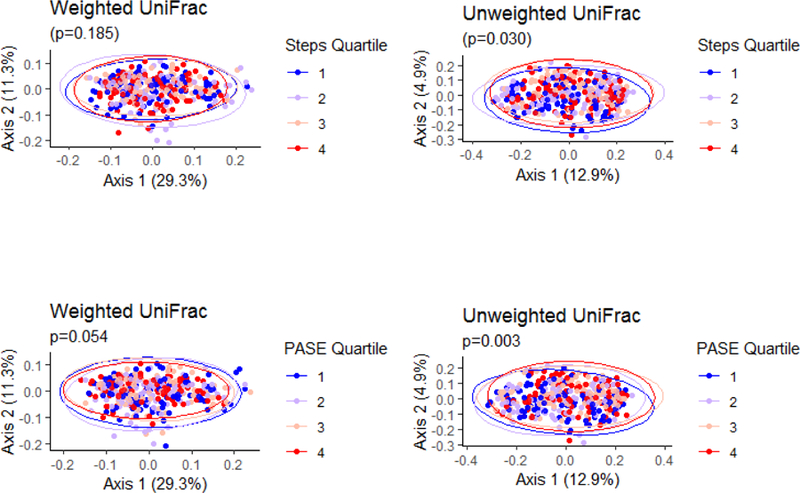
(a) Steps and weighted Unifrac: 0.185 (crude), 0.164 (adjusted)
(b) Steps and unweighted Unifrac: 0.029 (crude), 0.087 (adjusted)
(c) Self-reported PA (PASE) and weighted Unifrac: 0.052 (crude), 0.077 (adjusted)
(d) Self-reported PA (PASE) and unweighted Unifrac: 0.003 (crude), 0.007 (adjusted)
Multivariate models adjusted for age, race, BMI, clinical center, library size, and # of chronic conditions (fall history, hip fracture, myocardial infarction, stroke, congestive heart failure, diabetes, cancer, COPD, rheumatoid arthritis, osteoarthritis, depression, visual impairment, Parkinson’s disease, and Alzheimer’s disease).