Figure 1.

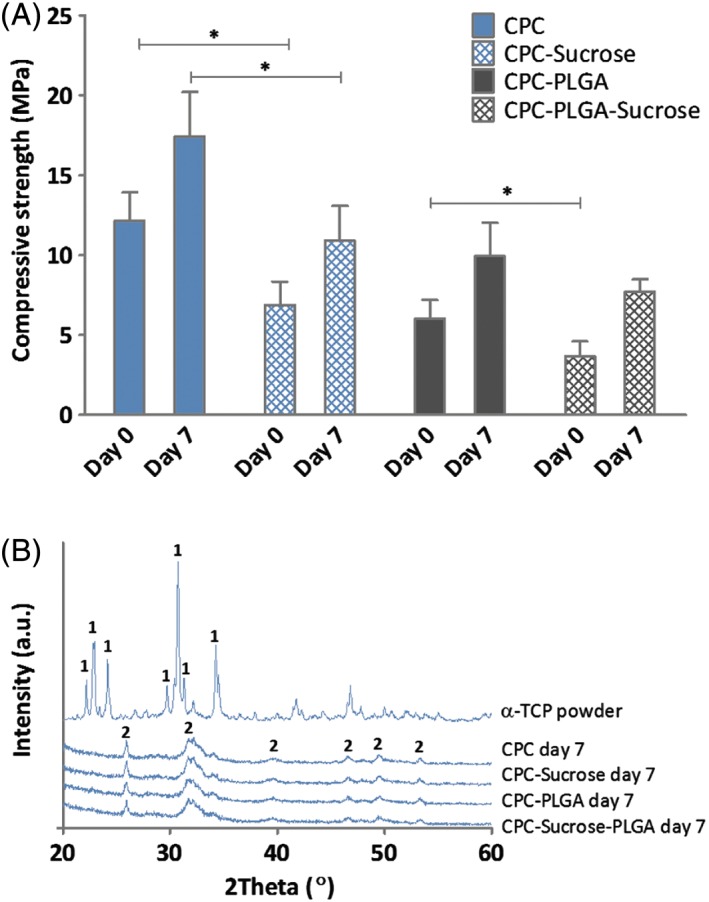
(A) Characterization of CPC formulations. Compressive strength (MPa) of the different CPC‐porogen formulations upon setting (n = 10) (*p < 0.05; error bars represent standard deviation (SD); Kruskal‐Wallis test with a Dunn's multiple comparison post‐hoc test) and (B) XRD patterns of α‐TCP powder (control) and the different CPC‐porogen formulations after 7 days of incubation, showing transition of α‐TCP (1) to hydroxyapatite (HA; 2) upon immersion in aqueous solution for all formulations.
