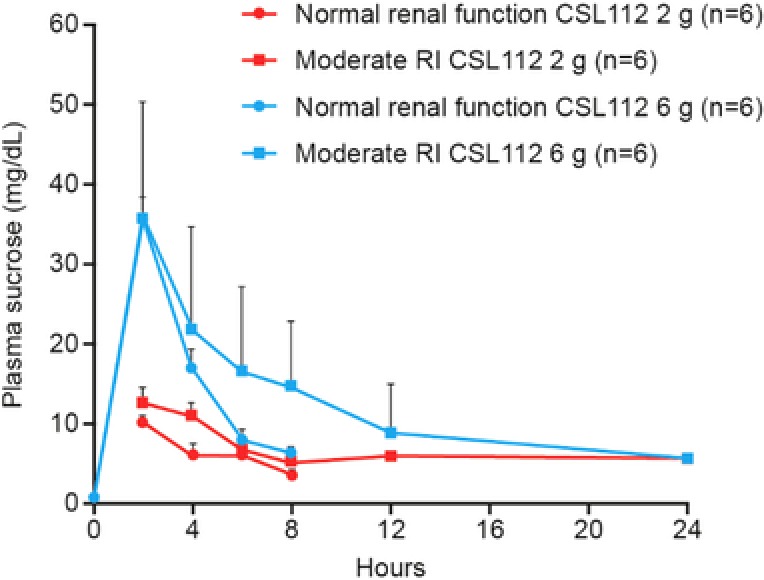
Figure 4.

Pharmacokinetic profile of sucrose in plasma following CSL112 infusion. Shown are mean + standard deviation unadjusted sucrose plasma concentration‐time profiles for each renal function group, moderate renal impairment (RI), and normal renal function following infusion of CSL112 2 or 6 g.
