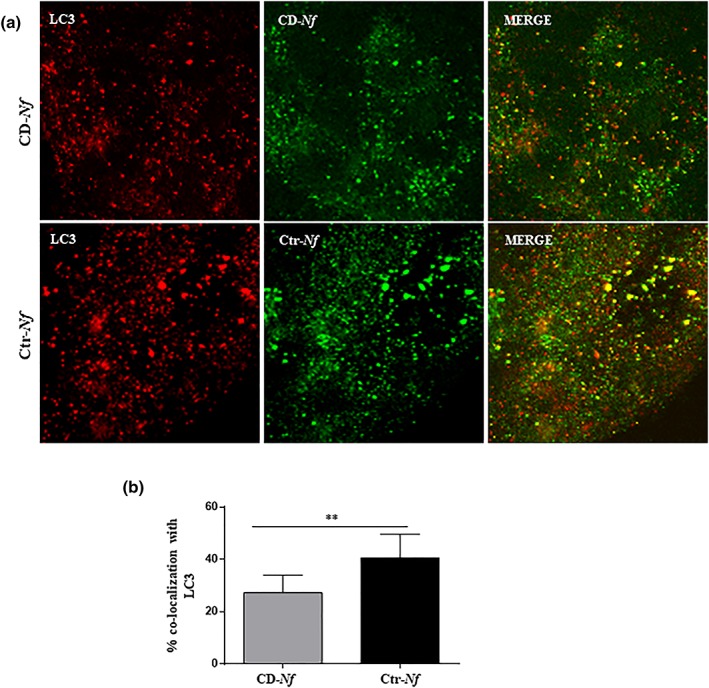
Figure 2.

Celiac disease (CD)‐Neisseria flavescens colocalised less with light chain 3B (LC3) than controll (Ctr)‐N. flavescens . (a) Fluorescence images of CaCo‐2 cells infected with CD‐N. flavescens and Ctr‐N. flavescens. CD‐N. flavescens and Ctr‐N. flavescens are shown in green; LC3 is shown in red and yellow indicated colocalisation. (b) Statistical analysis of the LC3/CD‐N. flavescens or Ctr‐N. flavescens colocalisation in CaCo‐2 cells. The experiments were replicated 9 times. The columns and bars represent the mean and standard deviation. Student's t test ** P < .01
