
Figure 2.
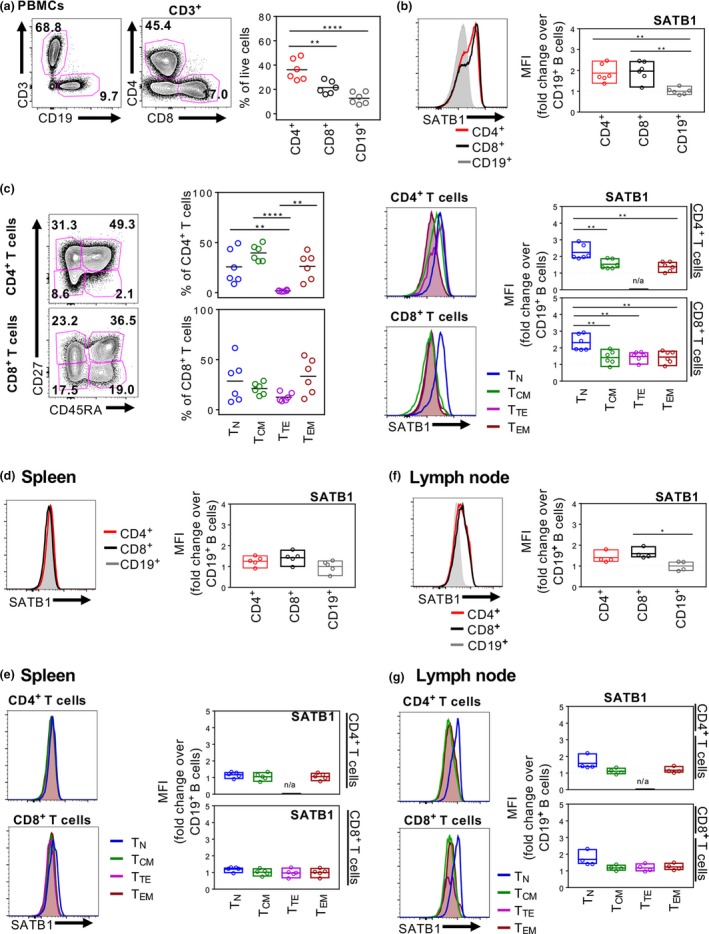
Diminished SATB1 expression in human spleen. Representative FACS plots and summarized CD4+, CD8+ CD3+ T cell and CD19+ B cell populations in adult PBMCs (n = 6) (a) and their respective SATB1 expression as MFI‐fold change over B cells in PBMCs (b) spleen (n = 5) (d) and lymph node (n = 4) (f). CD27+ CD45RA +, CD27+ CD45RA −, CD27− CD45RA +, CD27− CD45RA − T‐cell compartments of CD4+ and CD8+ T cells from adult PBMCs (c) with their respective SATB1 expression as representative histograms and MFI‐fold change over CD19+ B cells in PBMCs (c), spleen (e) and lymph node (g). One‐way ANOVA was performed between groups (*P ≤ 0.05; **P ≤ 0.01, ***P ≤ 0.001, ****P ≤ 0.0001). Experiments were performed once for each donor within each tissue.