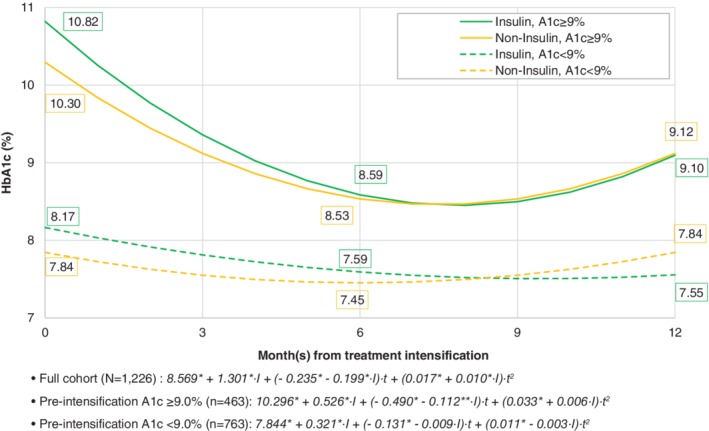
Figure 3.

Changes in glycated haemoglobin (HbA1c) by treatment intensification (insulin vs. oral antidiabetic drugs [OAD] or glucagon‐like peptide‐1 receptor agonists [GLP‐1RAs]), HbA1c trajectories from subgroup analysis for insufficient (<75 mmol/mol or 9.0%) and poorly (≥75 mmol/mol or 9.0%) controlled HbA1c before treatment intensification. Note. t, temporal distance in month(s) from the date of treatment intensification; I = 1 for patients receiving insulin for the intensification; I = 0 for patients receiving GLP‐1RAs or OADs for the intensification; * P < 0.05, ** P < 0
