
Figure 2.
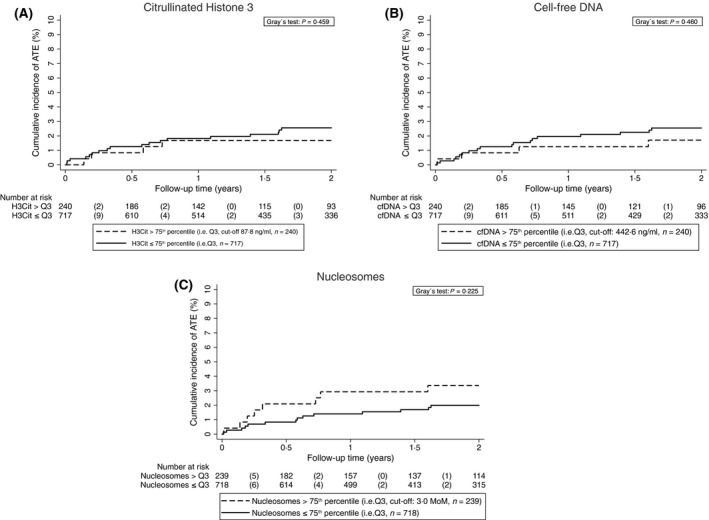
Cumulative incidence of ATE accounting for competing risk (i.e. death of any cause) according to H3Cit, cfDNA, and nucleosome levels. Note the scaling of y‐axis from 0% to 10% of ATE risk. ATE, arterial thromboembolism; cfDNA, cell‐free DNA; H3Cit, citrullinated histone 3; MoM, multiple of the median; Q, quartile.