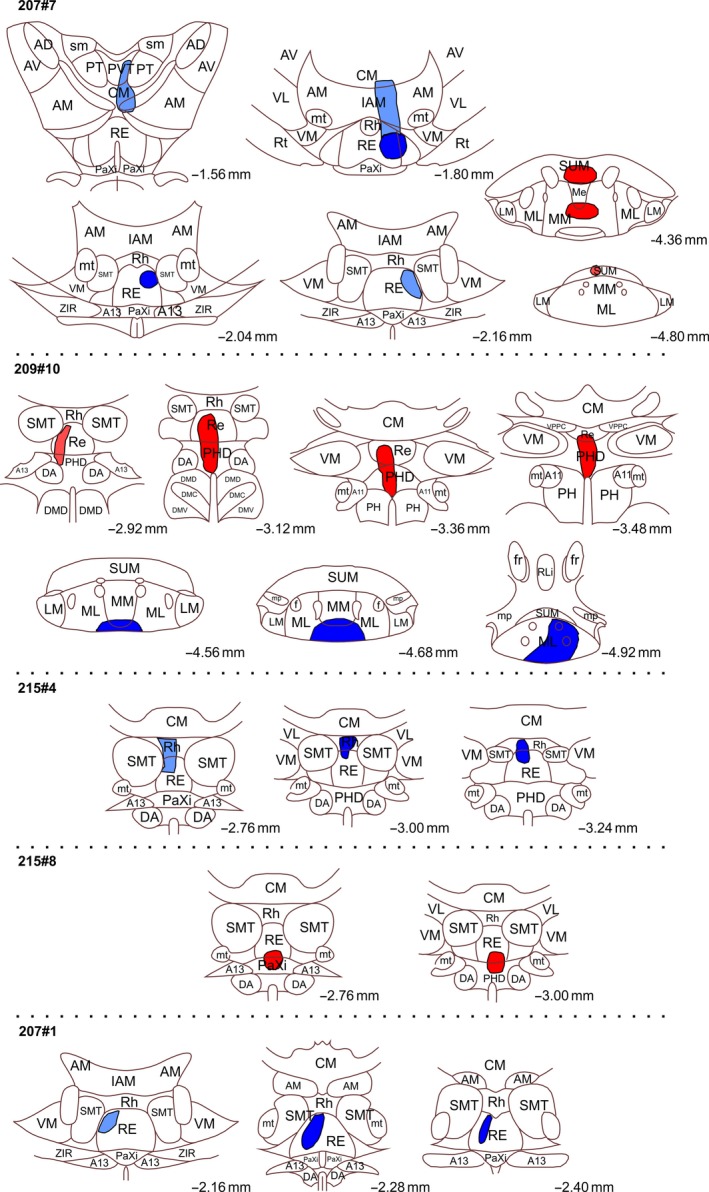
Figure 2.

Line drawings of five of the cases with retrograde tracer injections. CTB injections are shown in red and FB injections in blue. In all cases the extent of the visible tracer deposits are depicted. “Dark” colours indicate portions with dense tracer uptake whereas “light” colours indicate a weaker tracer signal. The injections are plotted onto modified templates from Paxinos and Watson (2004) (see text) and the numbers indicate the approximate position from bregma. Abbreviations as Figure 1. [Colour figure can be viewed at wileyonlinelibrary.com]
