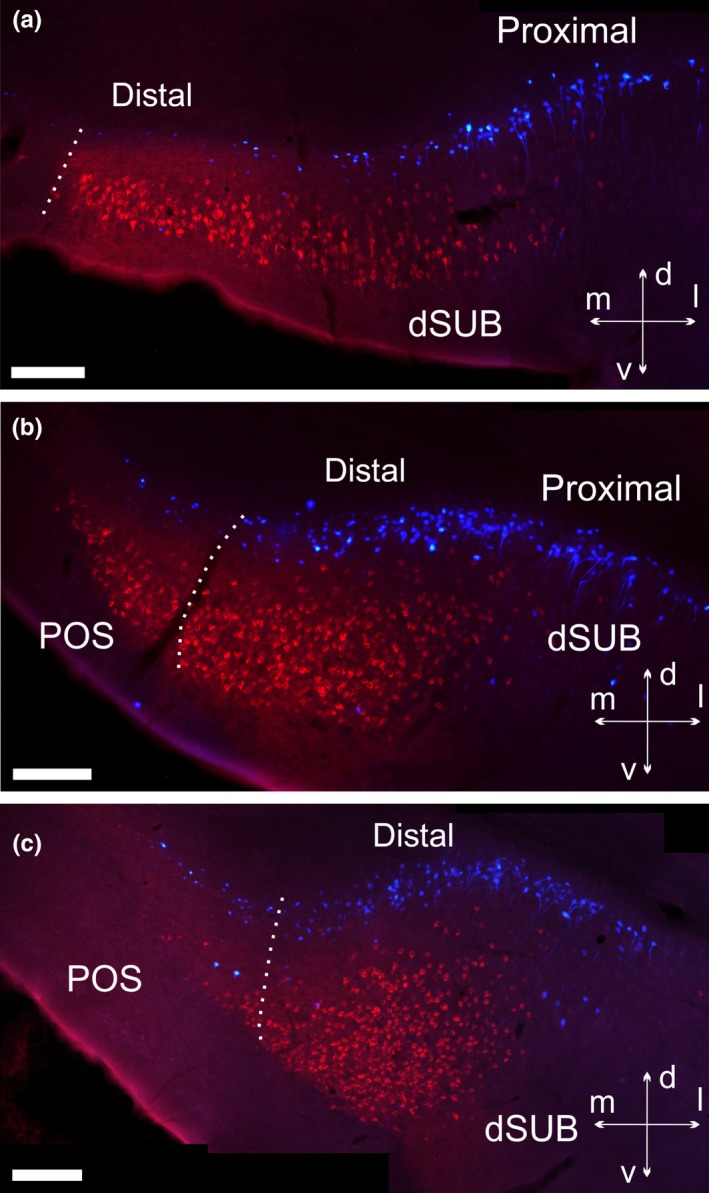
Figure 6.

Photomicrographs showing the distribution of retrograde labelled cells in case 207#2. a, b, c: 10× tile images of retrograde labelled cells in the dorsal subiculum at rostral levels. Images are shown as overlays of the two filter channels (N21 and DAPI). The three images are organized from rostral (upper) to caudal (lower). In all sections the two cell populations are distinct and reflect a laminar organization, with the FB labelled cells positioned deep to the CTB labelled cells. The CTB injection site within the mammillary bodies (see Figure 1) includes entering fornix fibres, which may explain the particularly dense subiculum labelling, with additional dense label in the postsubiculum. dSUB, dorsal subiculum; POS, postsubiculum. Scale bars = 200 μm. [Colour figure can be viewed at wileyonlinelibrary.com]
