Figure 2.
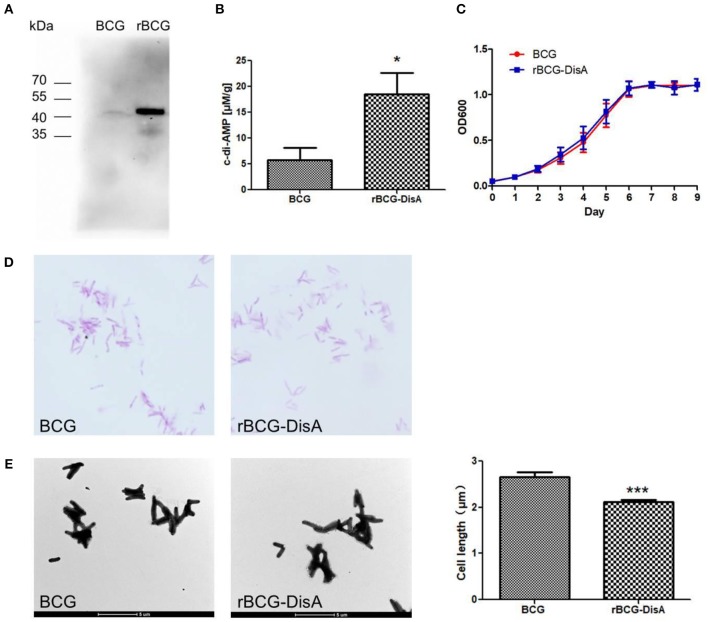
Characterization of rBCG. (A) DisA was examined in BCG and rBCG using Western Blot analysis with anti-DisA polyclonal antibody. (B) Determination of intracellular c-di-AMP concentrations of the BCG and rBCG-DisA strains by HPLC. (C) Bacterial growth curve of the BCG and rBCG-disA strains. The growth was monitored using a microplate reader at 600 nm from day 1 to day 9 at 24-h intervals. (D) Morphology of the BCG and rBCG-DisA strains stained with Ziehl-Neelsen acid-fast staining and observed under a light microscope (1 000×). (E) Morphology of BCG and rBCG-DisA strains observed by transmission electron microscope (4 200×), and bacterial cell sizes (n = 100) were measured by Image J software. *P < 0.05, ***P < 0.001.

