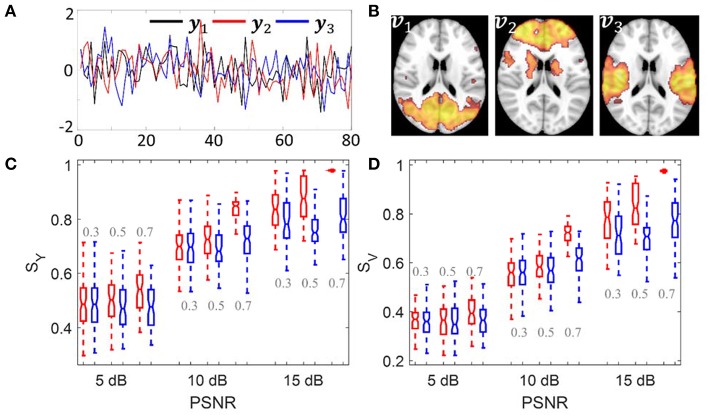
Figure 3.
Simulation 1: Comparison of sPCA and PCA. (A) Simulated principal component scores Y = [y1, y2, y3]. (B) The spatial maps V = [v1, v2, v3] corresponding to the scores with 70% voxels having zero values. Simulated data were generated 100 times with PSNR as 5 dB, 10 dB and 15 dB and sparsity level as 0.3, 0.5, and 0.7. (C) Boxplot for the similarity value with true principal component scores SY. (D) Boxplot for the similarity value with true spatial maps SV. The boxplot for sPCA is shown in red and for PCA in blue.

