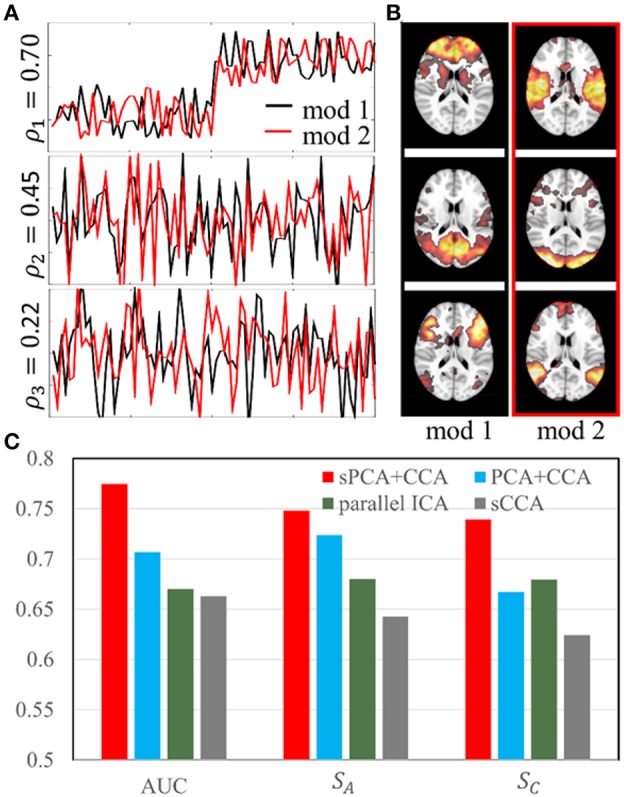
Figure 4.

Simulation 2: Comparison of fusion methods. (A). Three pairs of simulated modulation profiles satisfying the orthogonality condition. (B). Simulated spatial maps at sparsity level 70%. (C) Bar plot of the AUC measurement, similarities (SA) between estimated and true modulation profiles, and their corresponding spatial maps (SC).
