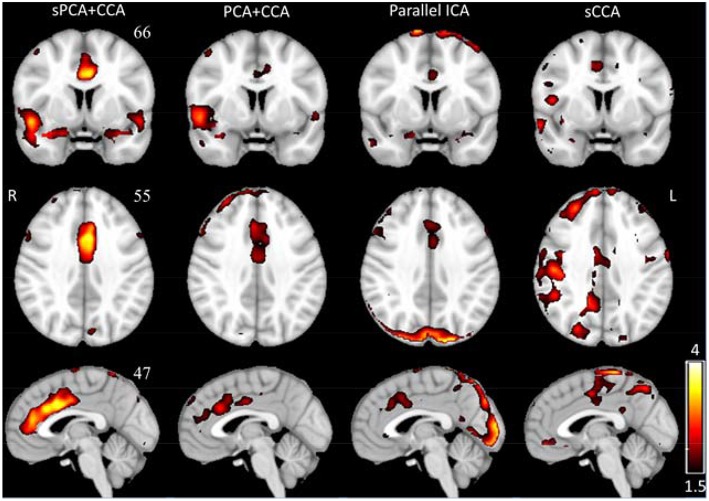
Figure 6.
The most significant disease-related ECM z-score maps from sPCA+CCA, PCA+CCA, parallel ICA and sCCA. Maps are displayed in radiological convention (right is left and vice versa). All spatial maps are thresholded at z ≥ 1.5 except the map from parallel ICA that is thresholded at z ≥ 1. Parallel ICA would not show the anterior cingulate cortex if the map is thresholded at z ≥ 1.5.

