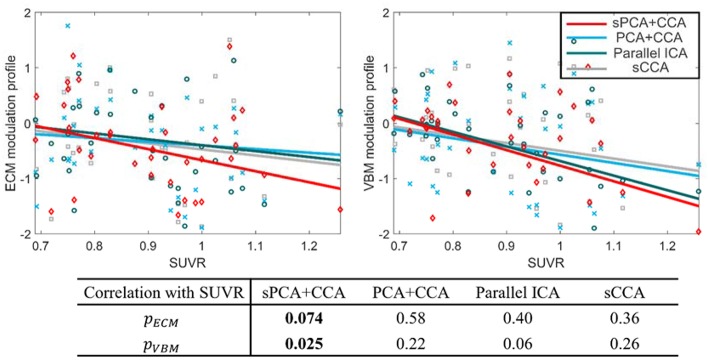
Figure 9.
Correlation between the most significant modulation profiles in ECM and VBM modalities with SUVR. The significance p-values for ECM (pECM) and VBM data (pVBM) in sPCA+CCA, PCA+CCA, parallel ICA and sCCA are also shown. The SUVR measures the content of ß-amyloid using PET scanning. The ECM modulation profile of the disease-related pattern measures the strength of functional connectivity. A more negative value indicates lower functional connectivity. The VBM modulation profile of the disease-related pattern relates to the amount of atrophy. More atrophy is present for negative values of the VBM modulation profile. Note that sPCA+CCA has the most significant negative correlation with SUVR.

