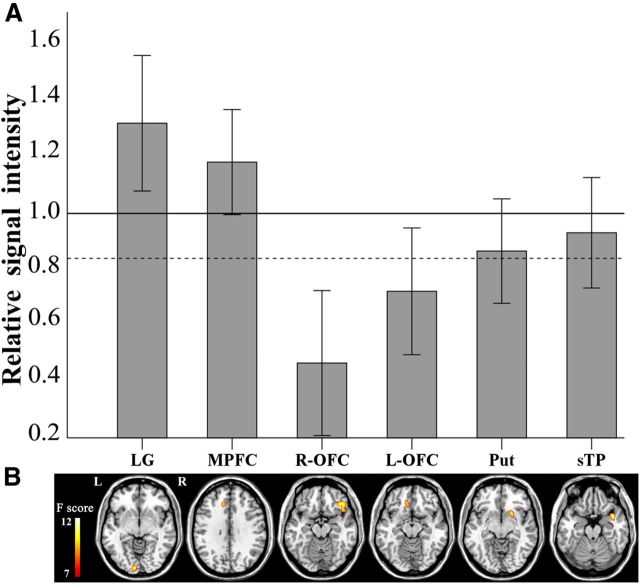
Figure 1.
Relative MRI signal intensities (A) of brain regions (B) with significant main effects of genotypes or interactions between genotypes on local or long-range FCDs. The horizontal axis represents six brain regions with significant main effects of genotypes or interactions between genotypes. The solid line represents the mean signal intensity of the whole-brain gray matter. The dashed line represents the lower limit of twice the SD of the signal intensity of the whole-brain gray matter. Bars show the F values. The two orbitofrontal clusters were excluded from additional analyses because the mean signal intensities of the two clusters were lower than the lower limit. L, Left; L-OFC, left orbitofrontal cortex; Put, putamen; R, right; R-OFC, right orbitofrontal cortex.

