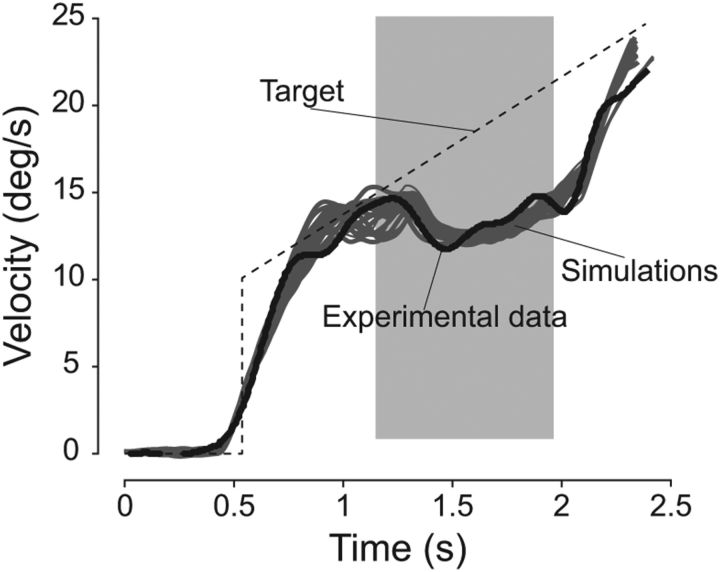
Figure 11.
Anticipatory eye movements and tracking of an accelerating target. Simulations (in gray) are compared with experimental data (black trace) with the same target conditions (target motion is represented by the dashed line). The target underwent a velocity step of 10°/s and a constant acceleration of 8°/s2 for 2 s, after the fixation period. It was blanked for 800 ms (gray box). Experimental data are adapted from Bennett and Barnes (2006).

