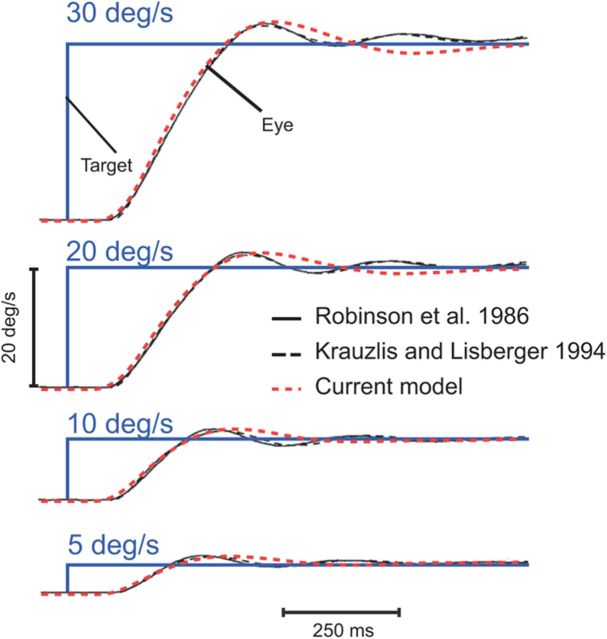
Figure 5.
Comparison with previous models. Initiation of pursuit in response to targets moving at 5, 10, 20, and 30°/s. Target velocity is represented in blue, simulations from the model of Robinson et al. (1986) are shown in continuous black traces, simulations from the model of Krauzlis and Lisberger (1994) are shown in dashed black traces, and simulations from our model are shown in red (average over 30 simulations).

