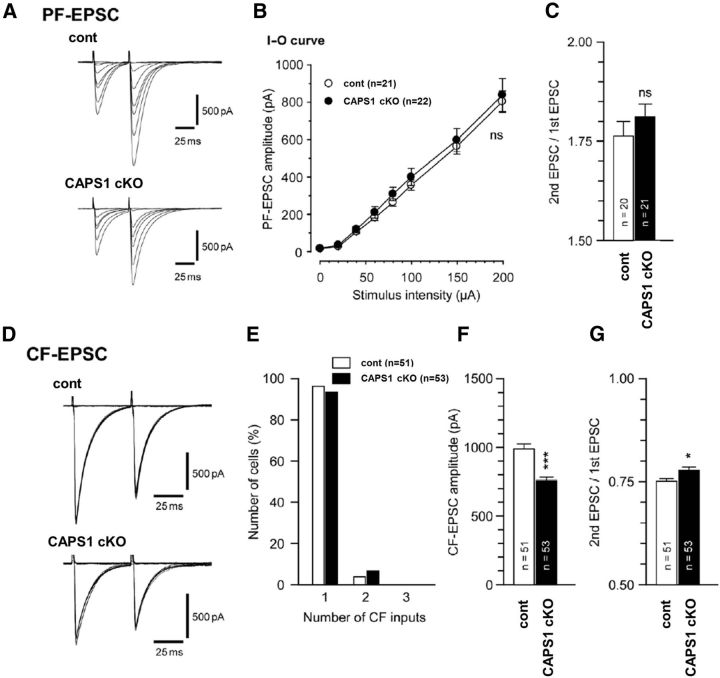
Figure 7.
Reduced EPSC amplitude and lower release probability at climbing fiber (CF)–Purkinje cell synapses in Caps1 cKO mice. A, Representative EPSC traces evoked by parallel fiber (PF) stimuli of different stimulus intensities (0–200 μA, 10 μs, 50 ms interstimulus interval, Vh = −80 mV). B, Plots showing the input–output (I–O) relationship of the parallel fiber–EPSC amplitude in wild-type littermates (open circles; n = 21) and Caps1 cKO mice (filled circles; n = 22). C, The mean paired-pulse ratio of parallel fiber–EPSCs in each genotype (50 ms interstimulus interval). D, Representative EPSC traces evoked by climbing fiber (CF) stimuli of different stimulus intensities (0–200 μA, 10 μs, 50 ms interstimulus interval, Vh = −10 mV). E, A histogram showing the relationship between the percentage of the number of Purkinje cells and the number of climbing fiber inputs onto a single Purkinje cell in control (open columns; n = 51) and Caps1 cKO (filled columns; n = 53) mice. F, Averaged climbing fiber–EPSC amplitudes in control and Caps1 cKO mice. ***p = 3.28 × 10⁻⁶, by the Mann–Whitney U test. G, The mean paired-pulse ratio of climbing fiber–EPSCs in each genotype (50 ms interstimulus interval). *p = 0.016, by the Mann–Whitney U test. The error bars indicate the SEM. cont; Control.

