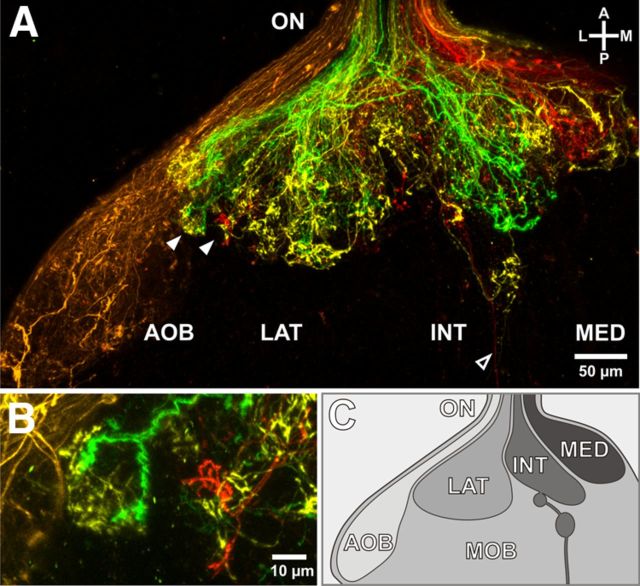
Figure 1.
Visualization of axonal projections of ORNs and VRNs. A, Sparse labeling of olfactory sensory neurons reveals the structure of the OB (only one OB hemisphere is depicted). Different colors represent different labeling sites in the nose: orange represents VNO; green, lateral part of the MOE; yellow, intermediate part of the MOE; red, medial part of the MOE. The accessory OB is a clearly separated structure receiving only vomeronasal input. The different glomerular clusters of the main OB show a considerable amount of overlap between inputs from the individual labeling sites in the MOE. Some axons from the intermediate cluster bypass and leave the OB in caudal direction (open arrowhead). B, Individual glomeruli with axonal inputs from different locations in the nose can be identified (see also A, filled arrowheads). C, Schematic representation of the accessory and the main OB, which separates into a lateral, intermediate, and medial cluster. AOB, Accessory OB; INT, intermediate glomerular cluster; LAT, lateral glomerular cluster; MED, medial glomerular cluster; MOB, main OB; ON, olfactory nerve; A, anterior; P, posterior; L, lateral; M, medial.

