
Figure 4.
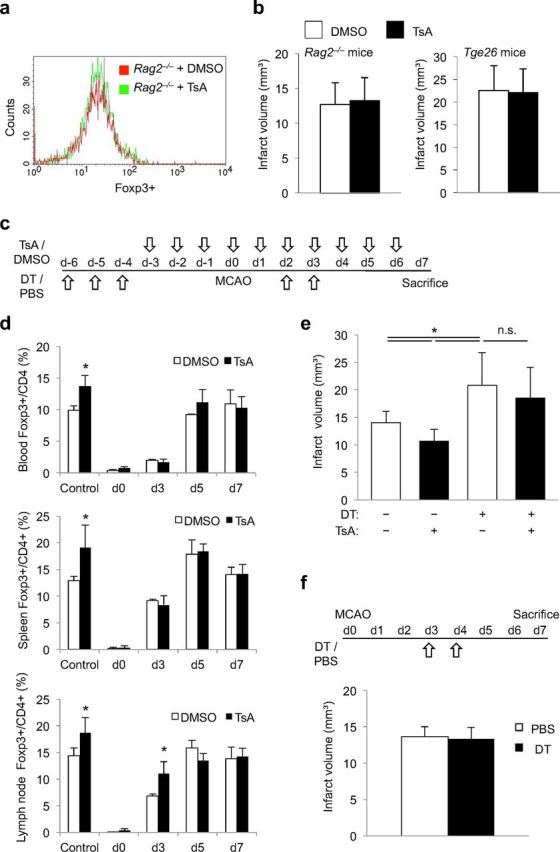
Reduction of infarct volume and neuroinflammation by HDACi is Treg dependent. a, Lymphocyte-deficient Rag2−/− mice were treated with TsA or control (DMSO). The representative histogram plot of the FACS analysis shows equal Foxp3 expression in the two treatment groups. b, Infarct volumes did not differ significantly between DMSO-treated control mice (white bars) and TsA-treated animals (black bars) in lymphocyte-deficient Rag2−/− mice (left, n = 12 per group, p = 0.67) and in lymphocyte- and NK cell-deficient Tgε26 mice (right, n = 7 per group, p = 0.89). c, Schematic overview of the treatment protocol for Treg depletion by DT injection and TsA treatment in Foxp3.LuciDTR-4 mice. d, Foxp3+ cell counts were determined by FACS analysis of blood, spleen, and mesenteric lymph nodes of control animals (PBS and DMSO treatment, no Treg depletion), and Treg-depleted animals (DT injected) receiving TsA or DMSO, respectively. Cell counts of Foxp3+ cells are presented as the percentage of the total CD4+ cell population and were measured at the indicated time points according to the treatment protocol shown above (three individual experiments per time point and treatment group). *Significant difference (p < 0.05) between DMSO and TsA treatment at the respective time point. e, Infarct volumes at 7 d after MCAO in control animals (PBS and DMSO treated) and in Treg-depleted mice (DT injection) receiving either DMSO or TsA according to the treatment protocol shown above (n = 18, two individual experiments; ANOVA, p = 0.008). Infarct volumes did not differ between DMSO- and TsA-treated animals after Treg-depletion (DT+). f, Mice received either DT injections for Treg depletion or PBS control treatment at days 3 and 4 after MCAO induction. Infarct volumes at 7 d after MCAO did not differ significantly (n = 10, p = 0.65).