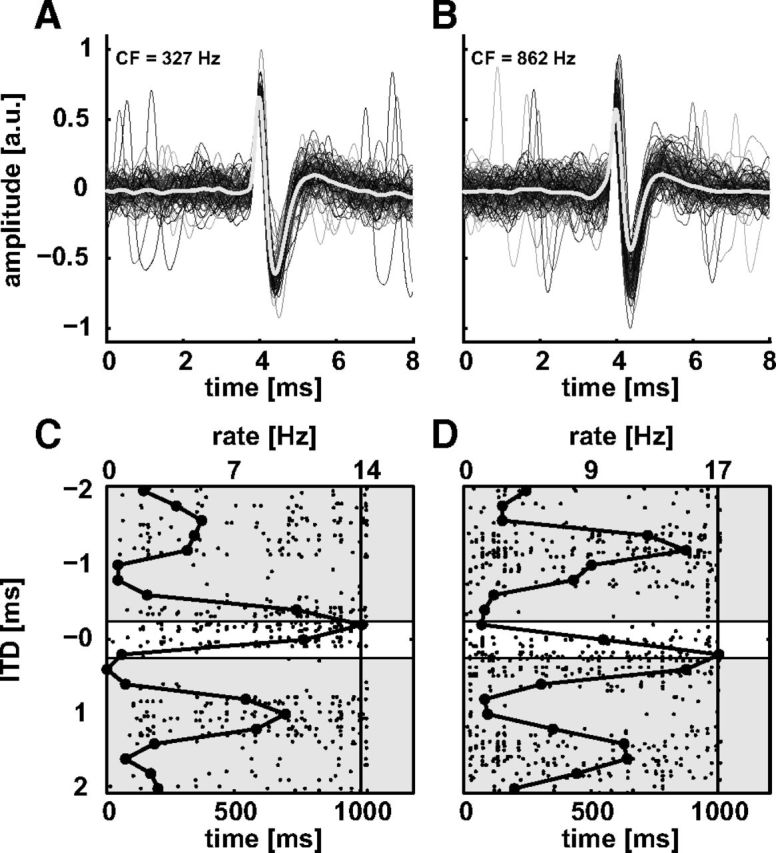
Figure 3.

Bipolar spike waveforms (A, B) and dot raster plots (C, D) of two neurons recorded in the LL with low-impedance pipettes. The neurons in A and B had CFs of 327 and 862 Hz, respectively. A, B, Individual spikes are shown in shades of gray and the mean spike shape waveform is shown as a white trace. C, D, Raster plots and noise delay functions (black line with markers, top abscissa) to correlated noise bursts for the units shown in A and B. The white patches indicate the approximate ethologically experienced ITD range of the chinchilla. The solid vertical lines mark the end of the steady state of the stimulus. Both neurons were clearly sensitive to change in ITD. Note that the neuron in A and C had a negative BD within the ethological ITD range. a.u., arbitrary unit.
