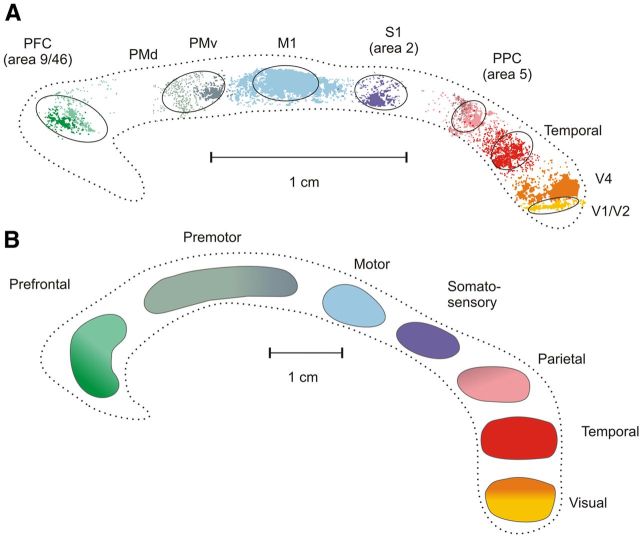
Figure 1.
A, Topographic organization of the CC of the macaque monkey after injections of anterograde BDA in different cortical areas. The image was obtained by superposition of the outlines of the clusters of axon labeling from six different animals [modified from Tomasi et al. (2012)]. Color gradients indicate axon labeling from different prefrontal (9, 46), premotor (dorsal, PMd F2/F7; ventral, PMv, F4), and parietal (PEc, PEa) areas. Ovals around axon labeling indicate the location and extent of the ROIs used for the visualization of callosal projections from MRI diffusion tractography. PFC, Prefrontal cortex; PMd, dorsal premotor cortex; PMv, ventral premotor cortex; M1, primary motor cortex; S1, primary somatosensory cortex (area 2); PPC, area 5, PEc, Pea; Temporal, area PaAC/TPt; V4, prestriate visual area 4; V1/V2, border between visual areas 1 (V1) and 2 (V2). B, Topography of the CC as visualized by DTT in humans. The image was obtained by superposition of data on the distribution of callosal fibers from 13 human subjects.

